How to Read an EKG Quickly: A Step-by-Step Guide to Counting Heart Rate
This guide walks you through reading an EKG (ECG) the way clinicians do — a clear, repeatable order that helps beginners catch rhythm changes and conduction problems instead of missing them. You'll learn the normal waveforms (P, QRS, T), how to measure the key intervals, and three quick ways to count heart rate on an ECG: the Big Box Method, the 6-Second Method, and Square Counting.
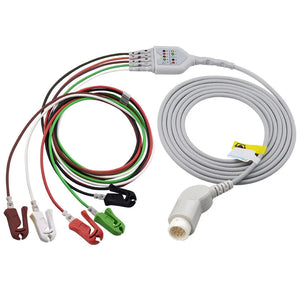
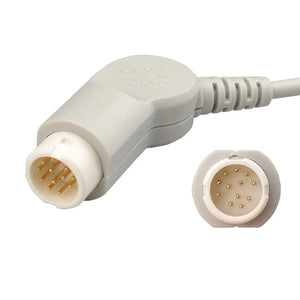
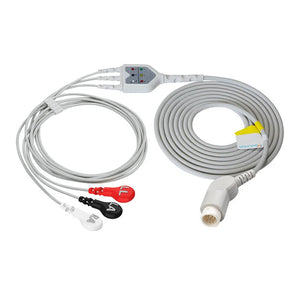
Accurate readings depend on a clean signal, so reliable accessories matter in busy hospital settings. Tools such as a 12-Lead ECG Trunk Cable and GE Healthcare–compatible disposable electrode pads help reduce artifact so the waveform reflects the patient, not the hardware.
Key Takeaways
- An EKG records your heart's electrical activity and helps diagnose rhythm and conduction problems.
- A clean signal path — quality electrodes and a shielded, securely-keyed trunk cable — produces clearer, easier-to-read tracings.
- Learn the normal waveforms: P wave, QRS complex, and T wave, and what each represents.
- Check rhythm systematically: regularity, rate, and the relationship between P waves and QRS complexes.
- Measure the key intervals: PR interval, QRS duration, and QT interval.
- Calculate heart rate with the Big Box Method, the 6-Second Method, or Square Counting.
- Avoid errors by confirming electrode placement and machine calibration before each reading.
- Regular practice with sample EKGs builds confidence and speed.
EKG Basics
What Is an EKG?
An electrocardiogram, or EKG, is a simple test that records your heart's electrical activity. It's painless: small electrodes placed on your skin pick up the electrical signals that make your heart beat, and the machine draws them as waves on a graph. The test can be done at rest or during exercise, and it shows how your heart works in real time.
You can use an EKG to check for heart rhythm problems, monitor ongoing treatment, or look for signs of heart disease. It's quick, noninvasive, and cost-effective, and it can be repeated as needed to track changes.
Healthcare providers use EKGs to diagnose rhythm issues, monitor how well treatments are working, and record the timing and strength of the heart's electrical impulses.
Why EKGs Matter
Doctors often order an EKG for chest pain, shortness of breath, or other heart-related symptoms — and sometimes before surgery or as part of a routine checkup when risk factors are present. The table below shows common reasons for ordering an EKG:
| Clinical Indication | Description |
|---|---|
| Cardiopulmonary complaints | EKG is part of the admission evaluation for these symptoms. |
| Pre-procedure cardiac evaluation | Needed before surgeries or procedures that stress the heart. |
| No cardiopulmonary complaints | Not usually needed unless your doctor says otherwise. |
| Case-by-case EKG requests | Your provider may order an EKG based on your unique health situation. |
Used this way, EKGs can help detect heart problems early, so you and your doctor can act quickly and track your heart's health over time.
Normal EKG Waves
When you look at an EKG, you see a series of waves. Each one tells you something about how your heart works, so learning what normal looks like helps you spot problems early.
- P wave: atrial activation — usually lasts less than 0.12 seconds and is not very tall.
- QRS complex: ventricular activation — sharp and narrow, lasting less than 0.10 seconds.
- ST segment: connects the QRS complex and T wave — should be smooth and blend into the T wave.
- T wave: follows the QRS complex — usually upright in most leads.
- U wave: sometimes appears after the T wave — less common but can be normal.

| Waveform | Characteristics |
|---|---|
| P Wave | Duration < 0.12 sec, amplitude < 2.5 mm, axis 0° to +75°, may be notched or biphasic. |
| QRS Complex | Duration ≤ 0.10 sec, variable amplitude, normal axis (+90° to −30°), small q-waves present. |
| ST Segment | Usually smooth and continuous with the T wave; normal elevation is concave upward. |
| T Wave | Usually in the same direction as QRS; upright in leads I, II, V3–6; inverted in aVR. |
| U Wave | Often overlooked; may be present following the T wave. |
EKG Components
P Wave
The first small bump on an EKG is the P wave. It reflects electrical activity starting in the upper chambers (the atria) and marks the beginning of each heartbeat — the signal that tells the heart to push blood from the atria into the ventricles. A normal-looking P wave means the upper chambers are working as they should.
The P wave shows atrial depolarization, which triggers atrial contraction. If the P wave is too tall or missing, consider possible atrial problems.

PR Interval
The PR interval is the flat line between the start of the P wave and the beginning of the QRS complex. It tells you how long the electrical signal takes to travel from the atria to the ventricles. The normal PR interval ranges from 0.12 to 0.20 seconds.
If the PR interval is longer than 0.20 seconds, you may have a first-degree heart block (the AV node is slowing the signal). Common causes of a long PR interval include:
- Fibrosis of the AV node
- High vagal tone
- Some medications (such as beta-blockers)
- Low potassium levels
- Acute rheumatic fever
- Carditis from Lyme disease
If the PR interval is shorter than 0.12 seconds, you may have a pre-excitation syndrome or a junctional arrhythmia. Always measure the PR interval — it helps you spot problems with electrical conduction.
QRS Complex
The QRS complex is the next big spike. It shows ventricular depolarization — when the lower chambers contract and send blood to the lungs and the rest of the body. It's usually sharp and narrow; if it looks wide or unusual, there may be a conduction problem in the ventricles. Always check the QRS complex for shape and width to find issues like bundle branch blocks or ventricular arrhythmias.
Use the table below to review the main EKG components and what each shows about your heart:
| Component | Description |
|---|---|
| P wave | Atrial depolarization (upper chambers start the heartbeat). |
| PR interval | Time from atrial to ventricular depolarization (signal travel time). |
| QRS complex | Ventricular depolarization (lower chambers contract). |
T Wave
After the QRS complex you'll notice the T wave — a gentle, rounded hill that shows the ventricles' electrical recovery (repolarization), the heart resetting for the next beat. In most leads the T wave points upward and looks smooth. A T wave that is flat, inverted, or very tall is worth a closer look alongside the patient's history and symptoms.
How to identify the T wave
- Find the QRS complex — the tall, sharp spike.
- Look right after it for a smaller, rounded wave: that's the T wave.
- Check that it's upright and smooth in leads I, II, and V3–V6.
- Compare its height to the QRS complex — the T wave should be smaller.

Why the T wave matters
Abnormal T waves can signal problems such as low potassium, heart attacks, or medication effects — sometimes they're the first sign of a serious condition. The table below summarizes why T-wave changes deserve close attention:
| Evidence | Clinical importance |
|---|---|
| T wave abnormalities can indicate underlying cardiac pathology. | They serve as early markers for various cardiac conditions, important for risk stratification and prevention of sudden cardiac death (SCD). |
| Inverted T waves or abnormal QRS-T angles are associated with higher SCD risk. | These changes can predict a two- to threefold increased risk of SCD, even after adjusting for conventional risk factors. |
| Minor ST-T abnormalities have been linked to reduced survival. | They can predict increased SCD risk in adults, underscoring the need for clinical evaluation. |
Always note any T-wave changes and report them to a healthcare provider — early detection can help prevent serious complications.
Reading an EKG: 5 Steps
Step 1: Check the Paper Speed
Always check the paper speed before reading. Most EKG machines use a standard speed of 25 millimeters per second (mm/s), which lets you measure time intervals and heart rate accurately. A different speed will throw off your calculations.
| Paper Speed (mm/s) | Small Square (1mm) | Large Square (5mm) |
|---|---|---|
| 25 | 0.04 seconds | 0.2 seconds |

Step 2: Check the Rhythm
Next, check whether the heart beats regularly or irregularly. A systematic approach makes sure you don't miss important details.
- Rate: count QRS complexes in a set time. A normal heart rate is 60–100 beats per minute; higher suggests tachycardia, lower suggests bradycardia.
- Pattern of QRS complexes: even spacing means a regular rhythm; if irregular, check whether the irregularity follows a pattern.
- QRS morphology: narrow complexes suggest the signal starts above the ventricles; wide complexes may mean a ventricular problem or abnormal conduction.
- P waves: look for a P wave before each QRS; their presence or absence helps identify conditions like atrial fibrillation.
- P–QRS relationship: make sure each P wave is followed by a QRS complex (atria and ventricles working together).
- Onset and termination: sudden starts or stops may suggest a re-entrant process.
- Response to vagal maneuvers: sometimes used to help tell different types of tachycardia apart.
Step 3: Identify Each Wave
Identify each wave to understand the heart's electrical activity and spot problems: start with the P wave (atria starting the beat), find the QRS complex (ventricles contracting), then locate the T wave (ventricles resetting).
For the best results:
- Use high-quality electrodes and cables to get a clear signal and reduce artifacts.
- Prepare the skin (clean it) and place electrodes in the correct spots.
- Pay close attention to lead placement — incorrect placement changes how waves look.
The table below shows a recommended systematic order for reading an EKG:
| Step | Description |
|---|---|
| Rhythm | Is the rhythm regular or irregular? (relationship between P and QRS) |
| Rate | Is it fast or slow? (tachycardia or bradycardia) |
| Ischemia or infarction | Look for ST changes and T-wave changes. |
| Axis | Check for left or right axis deviation. |
| Morphology | Assess for chamber enlargement or hypertrophy. |
| P-QRS-T | Evaluate intervals and wave progression. |

Step 4: Measure the Key Intervals
Measure the key intervals on every EKG — they reveal how electricity moves through the heart and can expose hidden problems. Use the small squares (each equals 0.04 seconds): count the squares for each interval, then multiply by 0.04.
- PR interval: from the start of the P wave to the start of the QRS complex (atria-to-ventricle signal time).
- QRS duration: the width of the QRS complex (how long the ventricles take to contract).
- QT interval: from the start of the QRS to the end of the T wave (contraction plus recovery).
Here are normal ranges for each interval:
| Interval Type | Normal Range (msec) | Normal Range (sec) | Small Squares |
|---|---|---|---|
| PR Interval | 125–196 | 0.12–0.20 | 3–5 |
| QRS Duration | 69–103 | 0.08–0.12 | 2–3 |
| QT Interval (QTcB) | 365–468 | 0.35–0.43 | 9–11 |
If intervals fall outside these ranges, look for possible causes: a long PR interval may mean a first-degree heart block; a wide QRS can signal a bundle branch block or ventricular rhythm; a prolonged QT interval increases the risk of dangerous arrhythmias.
Step 5: Look for Abnormalities
After measuring intervals, look for abnormalities that may need quick attention. Common EKG abnormalities include:
- Arrhythmias (irregular heartbeats)
- Ischemia (reduced blood flow to the heart)
- Enlarged or thickened heart muscle
- Signs of a previous heart attack
- Medication effects
- Electrolyte imbalances (such as low potassium)
- Structural changes in the heart
- Inflammation (such as pericarditis)
- Age- or gender-related changes, and other health conditions
T-wave abnormalities are among the most common EKG findings and may signal myocardial ischemia (the heart muscle not getting enough oxygen). If you see T-wave changes, consider the patient's risk factors and symptoms; studies show people aged 40–49 with T-wave abnormalities have a higher risk of serious cardiac events over the following five years. The EKG can also help diagnose inflammation such as pericarditis, where early treatment lowers the risk of recurrence.
Heart Rate Calculation Methods
You can calculate heart rate from an EKG in a few minutes once the tracing is clear. Each method suits certain rhythms — here's how the three compare:
| Method | Accuracy | Speed | Best for |
|---|---|---|---|
| Big Box Method | Less precise | Rapid approximation | Regular rhythm |
| Small Box / Square Counting | More precise | Moderate | Regular rhythm |
| 6-Second Method | More precise | Moderate | Irregular rhythm |
Big Box Method
The Big Box Method is one of the fastest ways to estimate heart rate when the rhythm is regular:
- Find two consecutive R waves (the tall spikes in the QRS complexes).
- Count the large boxes (big squares) between them.
- Divide 300 by the number of large boxes.
- Example: 4 large boxes between R waves → 300 ÷ 4 = 75 beats per minute.

6-Second Method
The 6-Second Method works for both regular and irregular rhythms — use it when the rhythm isn't steady or when you want a more accurate count:
- Find a 6-second section on the strip (usually marked with a line or number at the bottom).
- Count the QRS complexes (R waves) in that section.
- Multiply that number by 10 for beats per minute.
- Example: 8 QRS complexes in 6 seconds → 8 × 10 = 80 beats per minute.
Square Counting
Square Counting estimates heart rate from the pattern of large boxes between R waves:
- Start at an R wave that falls on a thick line (large box).
- Count each large box until the next R wave, using this sequence:
| Boxes to next R wave | 1 | 2 | 3 | 4 | 5 | 6 | 7 | 8 |
|---|---|---|---|---|---|---|---|---|
| Heart rate (bpm) | 300 | 150 | 100 | 75 | 60 | 50 | 43 | 37 |
If the next R wave lands between two thick lines, average the two numbers (e.g., between 75 and 60 → about 67 bpm).

How Do You Count Heart Rate on ECG?
To count heart rate on an ECG: confirm the paper speed (usually 25 mm/s), find the R waves, then apply one method — divide 300 by the number of large boxes between two R waves (regular rhythm), or count the R waves in a 6-second strip and multiply by 10 (irregular rhythm). You don't need advanced math — just a clear tracing and a systematic approach.
Step-by-step
- Check the paper speed: most machines print at 25 mm/s (shown at the top or bottom of the strip).
- Find the R waves: the tall spikes on the tracing.
- Choose your method: Big Box or Square Counting for regular rhythms; the 6-Second Method for irregular rhythms.
- Count the boxes or complexes: Big Box — count large boxes between two R waves and divide 300 by that number; 6-Second — count R waves in a 6-second strip and multiply by 10; Square Counting — use the 300/150/100/75/60/50 sequence.
- Double-check: if you get an unusual number, repeat or try a different method.

Common mistakes to avoid: don't count unclear or artifact-laden waves; don't forget to check the paper speed; and don't use a damaged or incompatible cable.
| Method | Best For | Steps | Example |
|---|---|---|---|
| Big Box Method | Regular rhythm | Count large boxes between R waves, divide 300 by the number | 4 boxes → 300 ÷ 4 = 75 bpm |
| 6-Second Method | Irregular rhythm | Count R waves in 6 seconds, multiply by 10 | 8 R waves → 8 × 10 = 80 bpm |
| Square Counting | Fast estimate | Use the box sequence (300, 150, 100, …) | R wave on 3rd box → 100 bpm |
If the tracing is messy or the rhythm changes, use the clearest part of the strip and repeat your measurement. A reliable, well-shielded cable also helps reduce noise for a better signal.
Common Mistakes to Avoid
Misreading Waves
You may misread waves if electrode placement is off or if you overlook artifacts. Small placement errors change how waves look — for example, placing V1 or V2 too high can alter the P, R, or T waves. Swapping electrodes or shifting them can also cause confusion, and artifacts (muscle tremor, loose cables) may mimic dangerous rhythms. Frequent wave-related mistakes include:
| Type of Error | Description |
|---|---|
| Vertical displacement | Electrodes placed too high, often toward the head. |
| Horizontal displacement | Electrodes moved sideways from their correct spots. |
| Interchange of electrodes | Electrodes swapped from their assigned positions. |
| High placement of V1 and V2 | Leads placed too high can change P, R, and T waves. |
| Artifacts in recordings | Noise or movement can mimic abnormal rhythms, leading to misdiagnosis. |
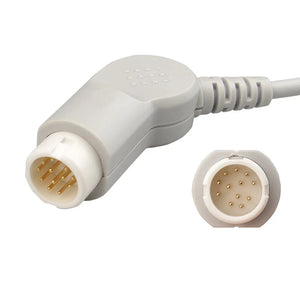
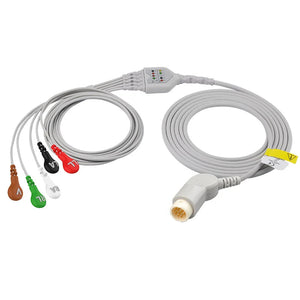
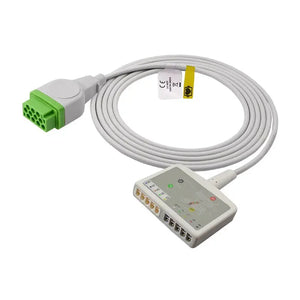
Loose or worn connectors and aging cable shielding are two of the most common sources of the "artifact" tracings above — noise that can be mistaken for a real arrhythmia. A securely-keyed, AHA/IEC color-coded trunk cable with intact shielding removes that variable, so the waveform reflects the patient, not the hardware.
Ignoring Calibration
Check your EKG machine's calibration before every reading. If calibration is off, the EKG may show false results and lead to missed or incorrect diagnoses. Proper calibration keeps measurements matched to true heart activity and guards against equipment drift.
- Improper calibration can cause inaccurate readings and misdiagnosis.
- Accurate calibration lets you trust the results.
- Regular checks prevent problems from equipment wear or faults.
Rhythm Confusion
Interpreting rhythms is harder if you don't know what causes abnormal patterns. Common causes of rhythm confusion:
| Cause | Description |
|---|---|
| Irregularities in heart rate | Make it hard to identify the rhythm pattern. |
| Structural abnormalities | Changes in heart shape or size disrupt electrical signals. |
| Enlarged heart size | Alters normal pathways, leading to abnormal rhythms. |
| Electrolyte imbalances | Affect the heart's electrical activity, causing unusual patterns. |
| Medication side effects | Some drugs change heart rhythm, making EKGs harder to read. |
| High blood pressure | Increases the chance of abnormal results. |
| Poor blood supply (ischemia) | Reduces oxygen to the heart, causing rhythm changes. |
| Heart attacks | Damaged tissue disrupts normal conduction, leading to abnormal readings. |
Practice & Support
Sample EKGs
Practicing with sample EKGs helps you remember patterns and spot changes faster. Reviewing many cases builds confidence and accuracy:
- Workshop-style practice outperforms traditional study methods.
- Learning by repetition and reviewing mistakes boosts retention.
- Spaced repetition and retrieval practice help you remember key features.
- Reverse pedagogy — interpreting before seeing the answer — strengthens your skills.
You can find sample EKGs in textbooks, online resources, and training modules. Practicing with quality electrodes and cables ensures clearer tracings to learn from.
Progress Tracking
Several methods help you track progress in EKG interpretation:
| Method | Description |
|---|---|
| Eye-tracking feedback | Visualizes your gaze patterns compared with experts, helping you focus on critical areas. |
| Structured training programs | Develop targeted visual strategies to reduce mental effort and speed up interpretation. |
| Web-based learning | Self-directed skill-building for all healthcare professionals. |
| Mixed learning methods | Combine stress management and simulations to help you adapt to real-world demands. |
| Gradual-complexity simulations | Step-by-step challenges that build expert-like performance and accuracy. |
| Self-directed web-based interventions | Enhance EKG interpretation skills across a range of healthcare professionals. |
Use these to set goals, measure improvement, and stay motivated. Many platforms offer quizzes, simulations, and feedback so you can learn at your own pace.
About MedLinket
MedLinket has focused on medical monitoring consumables for over 20 years (founded 2004) and is reported to be China's first listed company dedicated to patient-monitor accessories. The company exports to 117+ countries and regions and supplies 2,000+ hospitals and customers, and every product — including the 12-Lead ECG Trunk Cable (GE Marquette Compatible, VE006-BAI) — undergoes 100% inspection before shipment.
| Certification / System | Description |
|---|---|
| ISO 13485:2016 | Quality management system for medical devices. |
| CE | Meets applicable EU safety, health, and environmental requirements. |
| FDA | Products cleared via the relevant U.S. FDA pathways. |
| MDSAP | Medical Device Single Audit Program for multiple regulatory jurisdictions. |

MedLinket has passed on-site audits from regulatory agencies and leading patient-monitor manufacturers (including NMPA, ANVISA, and audits by companies such as Mindray and Philips).
Conclusion
You can master EKG reading by working through a consistent routine:
- Check the R-R interval to determine heart rate.
- Assess whether the rhythm is regular or irregular.
- Confirm normal P waves, QRS complexes, and intervals.
- Use methods like counting boxes or the 6-second strip.
- Practice regularly to build pattern recognition and speed.
A clean signal is the foundation of every accurate reading — pair good technique with reliable accessories such as the 12-Lead ECG Trunk Cable (GE Marquette Compatible, VE006-BAI). Keep learning with resources such as ECGpedia and Core EM.
Frequently Asked Questions
How do you know if an EKG is normal?
Check for a regular rhythm; normal P waves, QRS complexes, and T waves; and intervals within standard ranges. Compare the tracing to reference examples, and use reliable equipment for a clear signal.
What is the easiest way to calculate heart rate on an EKG?
For a regular rhythm, count the large boxes between two R waves and divide 300 by that number (the Big Box Method). It gives a quick estimate in seconds.
Can you use the 12-Lead ECG Trunk Cable for both adults and children?
Yes — the 12-Lead ECG Trunk Cable, GE Marquette Compatible (VE006-BAI), supports adult and pediatric patients. It's a 7-foot latex-free cable with color coding for easy setup, currently US$88 (27% off the $120 list price).
What should you do if the EKG tracing looks unclear?
Check electrode placement and cable connections, replace any damaged accessories, and use a quality shielded cable for better signal clarity.
How often should you calibrate your EKG machine?
Calibrate before each use and follow the manufacturer's guidelines to ensure accurate readings and avoid misdiagnosis.
What warranty comes with the 12-Lead ECG Trunk Cable?
It comes with a 12-month warranty, along with the store's money-back guarantee if it doesn't perform like the OEM cable.
How do you avoid common EKG reading mistakes?
Use a systematic approach: confirm paper speed, electrode placement, and calibration; practice with sample EKGs; and use trusted accessories for a reliable signal.
Where can you buy the GE Marquette Compatible ECG Trunk Cable?
You can buy the 12-Lead ECG Trunk Cable (VE006-BAI) for US$88 (27% off the $120 list), with fast shipping and a 30-day return policy.
Declaration: All product names, brands, and OEM part numbers (e.g., GE Healthcare, Marquette, and associated model numbers such as 2106308-001) are used for identification and compatibility-reference purposes only and do not imply any affiliation, partnership, or endorsement. MedLinket products are independently verified compatible alternatives. Product images and actual objects may differ slightly in appearance (e.g., connector design, color) but function the same. This article is for educational purposes and does not constitute medical advice.