ECG Waveform & ST Segment Guide: How to Read Every Number on a Hospital Monitor
⚡ Quick Answer: ECG Waveform Components & Normal Ranges
- P wave: 0.06–0.12 sec — atrial depolarization
- PR interval: 0.12–0.20 sec — atrial conduction + AV node delay
- QRS duration: <0.12 sec — ventricular depolarization
- ST segment: isoelectric (flat); deviation ≥1 mm = ischemia/STEMI
- T wave: upright in most leads; inverted/peaked = ischemia or electrolyte issue
- QTc interval: <0.44 sec (men) / <0.46 sec (women) — prolongation risks torsades
- Heart rate (HR): 60–100 BPM, derived from R-R interval
📋 Key Takeaways
- The ST segment is the single most actionable ECG number on a bedside monitor — elevation ≥1 mm in 2 contiguous leads triggers cath lab activation; depression ≥0.5 mm signals subendocardial ischemia.
- Lead combination II + V4 + V5 achieves ~96% sensitivity for myocardial ischemia detection — the clinical foundation for continuous ST monitoring.
- PR, QRS, and QTc intervals are not just academic numbers — each has specific clinical thresholds that change immediate management decisions.
- Every ECG number depends on the signal chain: electrodes → leadwires → trunk cable → monitor algorithm. Hardware quality directly impacts every measurement.
- Off-center (eccentric) electrode design (Patent CN202120112524.5) reduces motion artifact by allowing 360° cable rotation without disturbing the skin interface — particularly valuable for ST monitoring and Holter recordings.
The ECG section of a patient monitor is the most information-rich display in clinical monitoring. While SpO₂ gives you one number and NIBP gives you three, the ECG simultaneously delivers heart rate, rhythm pattern, conduction intervals, ST segment status, arrhythmia alerts, and a continuous waveform — all from the same set of ECG cables and electrodes.
This guide focuses on the specific waveform components and intervals that monitors measure and display — and what each number actually means at the bedside. Created by the MedLinket clinical education team with input from biomedical engineers and clinical specialists across 2,000+ hospital customers in 118+ countries.
The ECG Signal Chain — Why Numbers Are Only as Good as the Hardware
Before diving into individual measurements, it's worth understanding why hardware quality is not a separate topic from clinical accuracy — it's the same topic. Every number the monitor displays is the output of an algorithm processing the analog signal that arrives from the patient. Noise, dropout, or baseline wander introduced anywhere in the signal chain corrupts every downstream calculation.
The ECG signal chain has four links:
- Electrodes (patient skin → electronic signal) — convert ionic body signals via Ag/AgCl interface; gel hydration and skin prep determine impedance
- Leadwires (electrode → trunk cable) — transmit the millivolt-level signal; damaged or worn leadwires introduce dropout
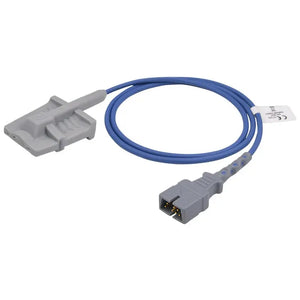
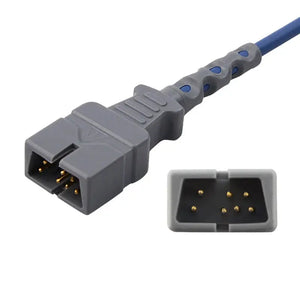
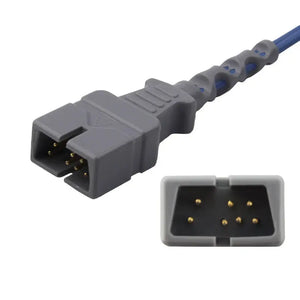
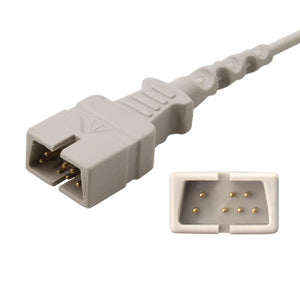
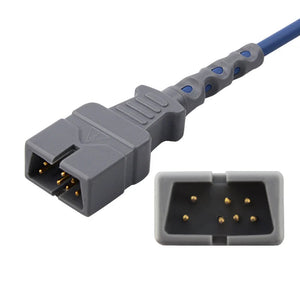
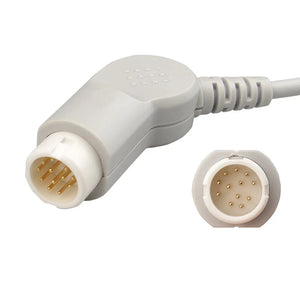
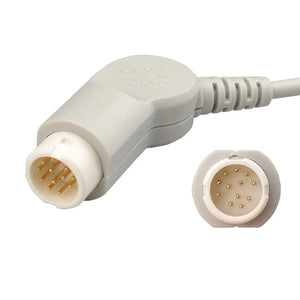
- Trunk cable (leadwire bundle → monitor) — connects to the monitor's specific input port; shielding determines EMI rejection
- Monitor algorithm (signal processing → displayed numbers) — filters, identifies QRS complexes, calculates intervals, runs arrhythmia detection
The first three are within your control. The fourth is fixed by the manufacturer. So when ECG numbers look wrong, the diagnostic question is always: which link in the signal chain is degraded?
🔗 Complete ECG Signal Chain — Quality at Every Link
Every ECG number on your monitor depends on three components working together. MedLinket manufactures all three at ISO 13485:2016 (TÜV) certified facilities, with $5M product liability insurance and 21+ years of monitoring-accessory experience.
- ECG Electrodes — patented eccentric design, foam/cloth/hydrogel/radiolucent options
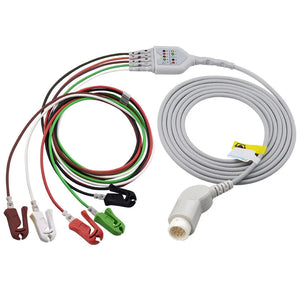
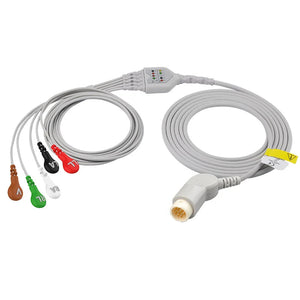
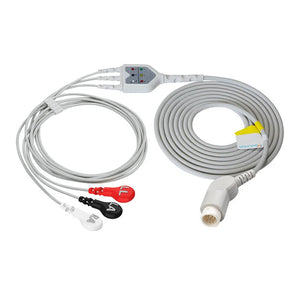
- ECG Leadwires — molded snap/grabber/pinch with anti-EMI shielding
- ECG Trunk Cables — brand-matched connectors for 30+ monitor brands
The PQRST Complex: Reading the Waveform on Your Monitor
The scrolling ECG waveform represents the heart's electrical activity during each cardiac cycle. The electrical impulse follows a predictable conduction pathway: SA node → atria (P wave) → AV node (PR interval delay) → Bundle of His → bundle branches → Purkinje fibers → ventricles (QRS complex) → ventricular recovery (T wave).
Each component has a normal duration, a normal morphology, and a specific set of abnormalities that signal clinical problems. Modern bedside monitors measure most of these automatically; understanding what they mean is what turns a number on a screen into a clinical decision.
P Wave — Atrial Depolarization
The P wave reflects depolarization of both atria. It is normally smooth, rounded, upright in lead II, and 0.06–0.12 seconds wide.
- Absent P waves → atrial fibrillation, atrial flutter, or junctional rhythm
- Peaked (tall, >2.5 mm) in lead II → right atrial enlargement ("P pulmonale")
- Notched or wide (>0.12 s) in lead II → left atrial enlargement ("P mitrale")
- Inverted in lead II → ectopic atrial focus or junctional rhythm
PR Interval — Atrial Conduction + AV Node Delay
The PR interval is measured from the start of the P wave to the start of the QRS complex. It reflects the time for the impulse to travel from the SA node, through the atria, across the AV node (where it is intentionally slowed), and into the ventricular conduction system.
| PR Interval | Interpretation | Clinical Action |
|---|---|---|
| 0.12–0.20 sec | Normal | None |
| >0.20 sec, fixed | 1st-degree AV block | Usually benign; review medications (beta-blockers, calcium channel blockers, digoxin) |
| Progressively lengthening, then dropped beat | 2nd-degree AV block, Mobitz I (Wenckebach) | Usually benign in inferior MI; monitor |
| Fixed, intermittent dropped beats | 2nd-degree AV block, Mobitz II | Higher risk of progression to complete block; may need pacing |
| P-QRS dissociation | 3rd-degree (complete) AV block | Emergency — pacing required |
| <0.12 sec with delta wave | Wolff-Parkinson-White (WPW) pre-excitation | Avoid AV-nodal blockers if AFib; cardiology consult |
| <0.12 sec without delta wave | Junctional rhythm or low atrial focus | Identify cause; usually well-tolerated |
QRS Complex — Ventricular Depolarization
The QRS represents ventricular depolarization. Width matters more than morphology for bedside interpretation:
| QRS Duration | Interpretation | Clinical Significance |
|---|---|---|
| <0.12 sec (narrow) | Normal ventricular conduction | Origin is supraventricular |
| 0.12–0.16 sec (wide) | Bundle branch block, hyperkalemia, or ventricular origin | Identify cause; check potassium |
| >0.16 sec (very wide) | Severe conduction disturbance, severe hyperkalemia, or ventricular tachycardia | Urgent — check labs, consider rhythm origin |
| Wide + regular + rapid | Ventricular tachycardia until proven otherwise | Treat as VT unless clearly proven SVT with aberrancy |
T Wave — Ventricular Repolarization
The T wave represents ventricular repolarization. It is normally upright in most leads, asymmetric (gradual upstroke, steeper downstroke), and concordant with the QRS direction.
- Peaked, narrow, "tented" T waves → hyperkalemia (one of the earliest ECG signs)
- Inverted T waves → ischemia, recent infarction, ventricular strain, or normal variant in some leads
- Flattened T waves → hypokalemia (often with U waves), nonspecific changes
- Hyperacute T waves (broad, tall, asymmetric) → very early STEMI, before ST elevation
QT and QTc Intervals — Total Ventricular Electrical Activity
The QT interval measures from the start of QRS to the end of the T wave — the total time for ventricular depolarization plus repolarization. Because QT shortens with faster heart rates, monitors typically calculate QTc (corrected QT) using Bazett's formula: QTc = QT / √(R-R interval).
| QTc Value | Interpretation |
|---|---|
| <0.44 sec (men) / <0.46 sec (women) | Normal |
| 0.44–0.50 sec | Borderline prolonged; review medications and electrolytes |
| >0.50 sec | Significantly prolonged; elevated risk of torsades de pointes |
| >0.55 sec | High risk; hold QT-prolonging drugs, correct K⁺ and Mg²⁺ |
ST Segment Monitoring: Detecting Ischemia at the Bedside
ST segment monitoring is the most clinically powerful capability of modern bedside monitors and the single most actionable ECG finding. The ST segment — from the J-point (where QRS ends) to the start of the T wave — represents the brief interval between ventricular depolarization and repolarization. When coronary blood flow is compromised, ischemic myocardium cannot maintain its normal membrane potential, producing measurable ST displacement that the monitor reports in millimeters.
How Continuous ST Monitoring Works
The monitor automatically identifies the J-point on each QRS complex and measures the vertical displacement of the ST segment 60–80 milliseconds after the J-point. This value is compared to a reference baseline (set by the user or learned from the patient's initial rhythm) and displayed continuously, usually as "ST-II: +0.2" or similar.
Most modern monitors track ST values for all monitored leads simultaneously and trigger an alarm when any lead deviates beyond a configurable threshold (typically ±1 mm or ±2 mm).
ST Elevation: The STEMI Decision
| ST Elevation Threshold | Clinical Significance | Action |
|---|---|---|
| ≥1 mm in ≥2 contiguous limb leads | STEMI suspected (inferior, lateral, or other) | Activate cath lab protocol; obtain 12-lead immediately |
| ≥2 mm in V2–V3 (men ≥40) | Anterior STEMI | Activate cath lab |
| ≥2.5 mm in V2–V3 (men <40) | Anterior STEMI | Activate cath lab |
| ≥1.5 mm in V2–V3 (women) | Anterior STEMI | Activate cath lab |
ST Depression: Subendocardial Ischemia
| ST Depression Pattern | Clinical Significance |
|---|---|
| Horizontal or downsloping, ≥0.5 mm at J+60ms | Subendocardial ischemia, unstable angina, or NSTEMI |
| Upsloping ≥1.5 mm | Less specific; consider stress-induced ischemia |
| Downsloping with T-wave inversion | Strongly suggestive of ischemia |
| Diffuse depression with aVR elevation | Left main or three-vessel disease pattern |
Lead Selection: Why II + V4 + V5 Achieves 96% Sensitivity
Research consistently shows that ST monitoring sensitivity depends heavily on which leads are selected. A 5-lead configuration with optimal lead choice captures the majority of ischemic events:
| Monitored Leads | Ischemia Detection Sensitivity |
|---|---|
| Lead V5 alone | ~75% |
| Leads II + V5 | ~80% |
| Leads V4 + V5 | ~90% |
| Leads II + V4 + V5 | ~96% |
| All 12 leads (V2 + V3 + above) | ~100% |
This is the clinical foundation of 5-lead bedside monitoring: a single precordial lead in addition to the standard limb leads dramatically improves ischemia detection compared to 3-lead monitoring. For ICU and high-risk telemetry patients, 5-lead is the minimum standard.
ST Reference Point Calibration
For continuous ST trending to be meaningful, the reference point must be set during a clinically stable, artifact-free moment. If you accept the monitor's default reference during a period of motion, lead-off, or pre-existing ischemia, all subsequent ST values will be relative to that bad baseline. Best practice:
- Wait for a stable rhythm with clean signal (no motion, no electrode noise)
- Manually set the ST reference point
- Re-set after any electrode change, position change, or acute event
Common ST Pitfalls — Not Every Elevation Is STEMI
- Left ventricular hypertrophy — ST depression with strain pattern in lateral leads
- Bundle branch blocks — secondary ST/T changes (Sgarbossa criteria help with LBBB + STEMI)
- Pericarditis — diffuse ST elevation across multiple territories with PR depression
- Early repolarization — common benign finding in young athletic males
- Digoxin effect — characteristic "scooped" ST depression in lateral leads
- Hyperkalemia / hypothermia — diffuse repolarization changes
- Brugada pattern — coved or saddle-shaped ST elevation in V1–V2
🔗 5-Lead ECG Cables for Continuous ST Segment Monitoring
The 96% ischemia detection sensitivity of leads II + V4 + V5 requires reliable 5-lead cables with low signal-to-noise ratio. MedLinket 5-lead cables feature injection-molded connectors and dividers (durable, waterproof, signal-stable), manganese steel pinch/grabber contacts rated for >20,000 cycles (exceeds the EC53 standard), color-coded molded leadwires that never delaminate, and through-shaft strain relief for bend resistance.
- Mindray: EA6252A (Pinch/Grabber, IEC) · EA6252B (Pinch/Snap, IEC) · 040-000961-00 (AHA)
- Philips: Telemetry 5-Lead (Snap, IEC, 0.9 m)
- GE Healthcare: 5-Lead Leadwires (Grabber, AHA, 36 in) · 412681-001 (Grabber)
- Nihon Kohden: 5-Lead (Pinch/Grabber)
Arrhythmia Detection on Modern Monitors
Modern bedside monitors include computerized arrhythmia detection algorithms that continuously analyze the waveform and trigger alarms for potentially dangerous rhythms. Understanding how these algorithms work — and why they fail — is essential for distinguishing real emergencies from artifacts.
How Detection Algorithms Work
Arrhythmia detection is fundamentally a pattern-recognition problem. The algorithm:
- Identifies each QRS complex by exceeding an amplitude and slope threshold
- Measures R-R intervals to derive heart rate and detect irregularity
- Compares each QRS morphology to a "template" learned from the patient's normal beats
- Classifies beats as normal, supraventricular, or ventricular based on width and shape
- Looks for sequential patterns (3+ consecutive ventricular beats = VT alarm)
Critical Alarms (Immediate Response Required)
| Alarm | Algorithm Trigger | Priority |
|---|---|---|
| Asystole | No QRS detected for >4 seconds | CRITICAL |
| Ventricular Fibrillation | Chaotic waveform, no organized QRS, fibrillatory frequency 4–6 Hz | CRITICAL |
| Ventricular Tachycardia | ≥3 consecutive wide-complex beats (>120 ms), rate >100 | CRITICAL |
Warning Alarms (Assess and Address)
| Alarm | Algorithm Trigger | Priority |
|---|---|---|
| Bradycardia | HR below configured low limit (typically 50–60 BPM) | WARNING |
| Tachycardia | HR above configured high limit (typically 120–140 BPM) | WARNING |
| AFib / AFlutter | Irregular R-R intervals + absent P waves | WARNING |
| PVC Run | ≥3 consecutive PVCs but <30 sec or organized rhythm continues | WARNING |
| Pause | R-R interval >2–3 sec | WARNING |
Why Algorithms Fail — and What You Can Fix
Most "false" alarms are actually correct algorithm responses to corrupted input. The five most common failure modes:
- T-wave overcounting — when the T wave is tall enough to cross the QRS detection threshold, the algorithm counts it as a beat, producing displayed HR roughly double the actual rate. Fix: change the monitored lead so the QRS is taller than the T wave.
- Pacemaker spike interference — large pacing artifacts can be miscounted as QRS, hiding underlying rhythm. Fix: enable the pacemaker recognition mode on the monitor.
- Motion artifact — patient movement creates wide deflections that look like ventricular beats, producing false VT alarms. Fix: secure cables, replace dried electrodes, and always confirm rhythm by feeling the pulse.
- Low-amplitude QRS — when QRS voltage is below the detection threshold, the algorithm may report asystole on a beating heart. Fix: change to a lead with a taller QRS, or adjust the QRS detection sensitivity.
- Lead-off — disconnected electrodes produce a flat trace that may be classified as asystole. Fix: see ECG leads off alarm fix.
How ECG Cable Quality Affects Every Measurement
Every ECG number on your monitor — heart rate, ST values, arrhythmia detection, QRS morphology — is only as reliable as the signal chain delivering data from the patient to the processor. Hardware quality is not "nice to have" — it is the foundation of clinical accuracy.
Signal-to-Noise Ratio Explained
The cardiac signal at the skin surface is on the order of 1 millivolt — extremely small. Even modest electrical noise (from muscle activity, electrode-skin impedance, EMI, or cable movement) can rival or exceed this signal. Better hardware doesn't make the signal stronger; it reduces the noise floor, improving the signal-to-noise ratio so the algorithm can correctly identify each waveform component.
Electrode Impedance: The Single Biggest Quality Factor
Electrode AC impedance is the dominant variable in ECG signal quality. The international standard YY/T 0196-2005 sets maximum AC impedance at 2,000 Ω. MedLinket disposable electrodes test at approximately 109 Ω — roughly 18× lower than the standard maximum. Lower impedance directly translates to a cleaner waveform, more accurate ST measurements, and fewer false alarms.
Why Frayed Leadwires Corrupt ST Numbers
A leadwire with internal fraying or oxidation introduces intermittent micro-dropouts. Each dropout causes a baseline shift the monitor's algorithm attributes to ST deviation. The result: false ST alarms that train clinicians to ignore the very alarm they most need to trust. Routine inspection and timely replacement (every 6–12 months in heavy use) is the cheapest insurance for ST monitoring reliability.
🔗 Patented Eccentric ECG Electrodes — Reduce False Alarms at the Source
Standard center-snap electrodes amplify cable pull and motion artifact directly into the ECG signal — corrupting ST measurements and triggering false arrhythmia alerts. MedLinket's patented eccentric (off-center) design (Patent CN202120112524.5) places the snap connection on a flexible base, allowing 180–360° cable rotation without disturbing the electrode-skin interface.
Performance: The eccentric design provides ≥2× the mechanical resistance of conventional center-snap electrodes, eliminating motion-induced artifacts and cable-pull dislodgement that distort ECG signals.
- Adult foam (50 mm): V0014 series — for ICU/CCU long-term monitoring
- Eccentric (off-center) adult: V0014H-L — for telemetry & Holter where patients move
- Pediatric cloth (40 mm): V0014L — for ED & Holter
- Radiolucent (carbon-fiber snap): V0015 series — invisible on CT, X-ray, DSA, MR
🔗 Radiolucent ECG Cables & Electrodes for Cath Lab / CT / MR
Standard ECG cables produce visible artifacts on CT, X-ray, DSA, and MR imaging — degrading both the image and the ECG. MedLinket's radiolucent ECG line uses non-metallic conductive composite materials engineered for medical imaging environments: invisible on imaging, with 5-layer EMI shielding and a rated life of ≥5,000 use cycles.
- Philips compatible: R0040C4A (5-lead, 1.0 m, 69 g) · RDG040C5A
- Mindray compatible: RJ075C3A · R0070C5A (5-lead, 1.0 m, 72 g)
- MR-Philips compatible: RC040C4A
When ECG Numbers Don't Match the Patient
The most reliable bedside cross-check takes two seconds and catches both sensor problems and true clinical emergencies. Compare the ECG-derived heart rate (from R-R intervals) to the SpO₂-derived pulse rate (from the plethysmographic waveform):
- HR ≈ PR (within 2–3 BPM): Data is reliable; both systems agree
- HR > PR significantly: Pulse deficit — the heart is generating electrical activity that isn't producing effective mechanical output. Causes include atrial fibrillation with rapid ventricular response, frequent PVCs without effective stroke volume, or true hemodynamic compromise
- HR < PR: Usually a sensor problem — ECG is undercounting (T-wave dropout, low QRS amplitude, lead-off), while SpO₂ is reading the true pulse
- Massive disagreement (HR 0, PR 80): Almost always lead-off; check electrodes immediately
Frequently Asked Questions
What is a normal PR interval?
A normal PR interval is 0.12–0.20 seconds (3–5 small boxes on standard ECG paper at 25 mm/s). It reflects the time from atrial depolarization through the AV node to the start of ventricular depolarization. Prolongation beyond 0.20 seconds indicates first-degree AV block; shortening below 0.12 seconds suggests pre-excitation (WPW) or a junctional rhythm.
What does a wide QRS mean on the monitor?
A QRS duration greater than 0.12 seconds indicates abnormal ventricular conduction. Causes include bundle branch block (the most common cause of stable wide QRS), ventricular origin of the rhythm (PVCs, ventricular tachycardia), hyperkalemia (especially when potassium >6.5 mEq/L), severe acidosis, sodium channel blocker toxicity, and ventricular pacing. A wide-complex tachycardia in any patient with cardiac history should be treated as ventricular tachycardia until proven otherwise.
How is QTc calculated and why does it matter?
QTc (corrected QT) adjusts the measured QT interval for heart rate using Bazett's formula: QTc = QT / √(R-R interval in seconds). Most monitors calculate QTc automatically. It matters because a prolonged QTc (>0.50 sec) significantly increases the risk of torsades de pointes — a polymorphic ventricular tachycardia that can degenerate into ventricular fibrillation. Common causes include QT-prolonging medications (amiodarone, sotalol, methadone, ondansetron, fluoroquinolones, antipsychotics), hypokalemia, hypomagnesemia, and congenital long QT syndrome.
What is the difference between ST elevation and ST depression?
ST elevation (≥1 mm above the isoelectric baseline in 2 contiguous leads) typically indicates transmural myocardial injury — a STEMI requiring immediate cath lab activation. ST depression (≥0.5 mm horizontal or downsloping at the J-point) indicates subendocardial ischemia, typically seen in unstable angina or NSTEMI. Both warrant urgent evaluation, but only ST elevation triggers the time-sensitive STEMI protocol. Note that other causes of ST elevation include pericarditis (diffuse pattern with PR depression), early repolarization (benign), left ventricular hypertrophy with strain, and Brugada syndrome.
What is the J-point on an ECG?
The J-point is the precise location where the QRS complex ends and the ST segment begins — the "junction" between depolarization and the early portion of repolarization. ST segment displacement is conventionally measured at the J-point itself, or 60–80 milliseconds after the J-point (depending on protocol). Modern monitors automatically identify the J-point on each beat for continuous ST trending. The J-point can be elevated in early repolarization (a benign normal variant), notched in Osborn waves of hypothermia, or distinct in a Brugada pattern.
How sensitive is continuous ST monitoring for catching MI?
Continuous ST monitoring sensitivity depends on which leads are monitored. Lead V5 alone catches about 75% of ischemic episodes; adding lead II improves this to 80%; the combination of leads II + V4 + V5 reaches approximately 96% sensitivity. Adding the remaining precordial leads (V2, V3) approaches 100% but requires a 12-lead acquisition rather than continuous bedside monitoring. This is the clinical rationale for 5-lead ECG monitoring as the standard for ICU and high-risk telemetry — the addition of even one precordial lead dramatically improves detection compared to 3-lead.
Why does the monitor count my heart rate as double the actual rate?
This is "T-wave overcounting" — when the T wave on the monitored lead is tall enough that the QRS detection algorithm classifies each T wave as an additional QRS complex. The displayed heart rate is then roughly double the patient's actual rate. The fix is to change the monitored lead to one where the QRS amplitude is significantly larger than the T wave — typically lead I or aVL if lead II shows tall T waves. Some monitors also allow manual adjustment of QRS detection sensitivity.
Can a wrong electrode position fake an arrhythmia?
Yes. Limb-lead reversals (most commonly RA-LA reversal) produce mirror-image P, QRS, and T waves in lead I and can mimic dextrocardia or be misinterpreted as a rhythm change. Misplaced precordial electrodes (V1–V6 too high, too low, or incorrect intercostal space) shift R-wave progression and can simulate or mask anterior infarction. Electrode placement directly affects ST measurements: even 1–2 cm of vertical displacement of V1–V2 can produce false ST elevation. For correct placement, see our 3/5/12-lead placement guide.
What causes false ST alarms on a hospital monitor?
The five most common causes of false ST alarms are: (1) baseline wander from patient movement or breathing, (2) frayed or oxidized leadwires introducing intermittent dropouts the algorithm interprets as ST shift, (3) dried electrode gel increasing skin-electrode impedance and corrupting the signal, (4) a poorly chosen ST reference point set during artifact, and (5) electrode position changes between reference setting and current monitoring. Ensuring fresh electrodes (changed every 24 hours), inspected leadwires, a clean reference baseline, and stable electrode positions eliminates the majority of false ST alarms.
What ECG cables and electrodes does MedLinket make?
MedLinket manufactures a complete ECG signal-chain product line: trunk cables (matched to Philips, GE, Mindray, Nihon Kohden, Dräger, and 25+ other monitor brands), leadwires (3/5/6/7/12-lead in snap, grabber, or pinch styles, both AHA and IEC color codes), disposable electrodes (foam, cloth, hydrogel, radiolucent, neonatal), one-piece direct-connect cables, Holter cables, and radiolucent imaging-compatible options. All manufactured in ISO 13485:2016 (TÜV) certified facilities with 100% factory testing.
Need ECG Cables, Leadwires, or Electrodes for Your Monitor?
Tell us your monitor brand and model. Our engineering team will verify compatibility and recommend the exact ECG products you need — free of charge. Clinical samples available for evaluation before bulk order.
📧 Email Us 💬 WhatsApp +852 6467 3105 Browse ECG Range21+ Years
Countries
Hospital Clients
MDSAP, MHRA
2016 (TÜV)
Product Liability
Disclaimer: This guide is intended for educational and clinical reference purposes. It does not replace clinical training, institutional protocols, or the advice of qualified healthcare professionals. Always consult your facility's policies and the patient's attending physician for clinical decisions. Reference values are based on widely cited clinical sources and may vary by patient population and clinical context. MedLinket (est. 2004, NEEQ: 833505) manufactures patient monitoring accessories — not diagnostic devices.